Campbell, Claire, Department of History, Bucknell University, 1 Dent Drive, Lewisburg, PA 17837, claire.campbell@bucknell.edu.
This project demonstrates the value of using historic maps to measure environmental change and anthropogenic impact on freshwater in the central Susquehanna River valley, as part of the upper Chesapeake watershed.
Christopher Magoc has observed that “the topography of the Mid-Atlantic is wrinkled by historic waterways” that tell us much about the environmental choices and costs of making modern America (2015). Though at first glance historic maps might seem appealing curiosities more than a source of usable environmental data, this poster will illustrate (literally) the rich archive of information contained in different genres of cartographic records.
Much of the information we have about riverine environments sits in the natural sciences, but an historical lens is essential to understanding how we arrived here. Maps record not only changing knowledge about the natural world, but also plans to transform it. They are unusual as sources because they depict a chronology of past, present, and future: they mark older interventions, documenting who was there and what was built; they record current occupants and practices; but they also declare – and try to legitimate – claims and agendas for future use. Maps show nature being made and remade. As Andrew Hurley has argued, historical research is a necessary partner to environmental remediation, by showing that the landscape is “the product of human decisions that could be undone” (2010).
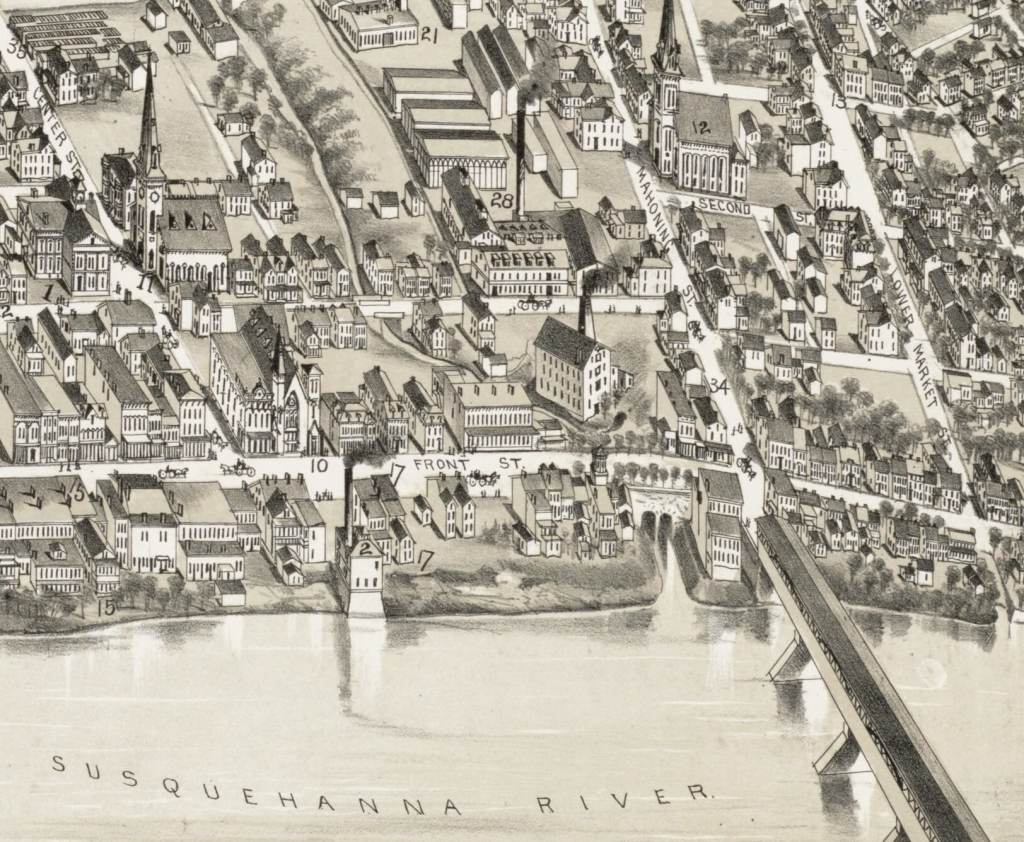
This poster will sample different cartographic records from the seventeenth century onward to demonstrate the array of sources available for researchers from all disciplinary backgrounds. These include manuscript maps, land surveys, insurance maps, bird’s eye maps, flood and topographical maps, aerial and satellite photography, as well as ‘narrative maps’ in travelogues and other written descriptions. With each we need to consider not only what (or where) the map is showing us, but how it does so, and the choices of scale, perspective, composition, and purpose. This research thus highlights the importance of cartographic literacy as part of both a liberal arts and environmental education.
These maps help us understand why our region looks the way it does. They identify sites of industrial activity and settlement (mill races, river dams, canal beds, railway routes, factory use, park corridors) and the effects on waterways (encroachment, diversion, channelization, pollution, rehabilitation). They mirror the changing energy regimes of the Anthropocene, from organic to mineral, and the mandates of what those in the eighteenth and nineteenth centuries called “improvement” – what those in the twenty-first might simply call “development.” Put another way, these historical clues allow us to trace what historian Donald Worster has called the “chains of environmental consequence” (2009).
